What’s a scientific experiment without pie charts? It’s incomplete, that’s what. So: You’ve already been presented with this data in tabular form. But these, you see, are pie charts.
First: Story categories. (Previous category analysis, with table, here.)

Second, object-function breakdown. (From yesterday.) With 15 slices, the legend is a bit hard to read. Pie graphs made with Create A Graph.

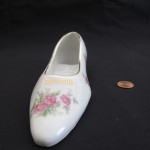
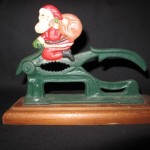
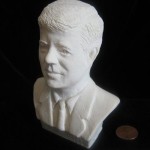


NOW we’re getting somewhere.