In cleverly devising a way of dealing with the Duration Factor, Josh addressed the potential effect on prices of both increased demand (as more people learned about the project) and dwindling supply (as we ran out of objects). It’s assumed that this Duration Factor caused prices to drift upward over time.
But in a comment to that post, reader Mimi offers theory she dubs “the Metal Boot Peak Effect.” Basically it suggests that the auction for Metal Boot With Story By Bruce Sterling, for $86, was a kind of turning point for the project, sparking a “process of disinhibition” that set the stage for much higher peak prices than we’d seen in our first three weeks. “I think,” she concludes, “these post MBPE peaks may be skewing your week-to-week averages.”
Well, enough speculation! For starters, what was the overall price trend? Here’s one answer in the form of a chart showing the average (or more precisely, the arithmetic mean) price paid, by week. (More charts and analysis after the jump.)
Let’s just say the results here aren’t quite as clean as what a Wall Street chartist would prefer. It’s pretty spiky. On the one hand, you can look at the first three weeks vs. the final three weeks, and the general upward drift is there. On the other hand, it’s probably an oversimplification for us to imply that prices simply rose week after week, given the extreme highs and lows in between.
In fact, it looks as if we were on the verge of peaking a mere week after the Metal Boot auction, when prices declined in Weeks 6 and 7 after a Week-5 high. Then weeks 8 and 9 were gangbusters — but week 10 saw a drop to one of the lowest averages of the entire project!
Week 10 was roughly our halfway point. Interestingly, it looks to me like that low point was followed by a relatively orderly rise. (The slip on Week 19 is a complete mystery to me)
Two questions: Does the actual time of year make any difference here? And: Would the results look similar if we used median (middle value), rather than mean (average), weekly sales figures.
Here you go:
By and large the average and middle value mostly correlate. The biggest disparity is in fact in Week 4 — Metal Boot week! The average price that week was $42.66, whereas the median was $17.82. The unusually high price for the Boot is part of the issue — but only part, since Sheila Heti’s Porcelain Shoe story also went for an unusually $77.51 that same week (in an auction that actually closed before the Boot.) Possibly, then, the unusually high average for that week is explained by the convergence of determined buyers not just on one object, but two that happened to go on sale days apart. Barefoot Buyer Syndrome, anyone?
Second, the time of year issue: I’ve listed the dates of the weeks that objects went on auction — meaning the sales closed the following week. So Week 7, one of our low points, was made up of auctions closing the last week of August. A time when lots of folks are away? We’ve speculated about that in the past. But Week 10 looks even worse on this chart, and those auctions would have closed in the latter half of September. So maybe time of year is a non-factor.
Mimi’s point about the MBPE got me curious about weekly high prices. I remember when I really didn’t think anybody would beat the $36.88 paid for Necking Team Button with Story by Susannah Breslin, from Week 1. (It’s easy to forget, but we really didn’t know how any of this was going to turn out; we were thrilled to get prices in excess of $20 back then, given what we were selling.)
This chart reminded that Duck Tray With Story By Stewart O’Nan, from Week 3, actually preceded both the Metal Boot and the Porcelain shoe as the object to break the Necking Team Button record, and moving us into a whole other realm of prices, selling for $71. Even so, my read is that I don’t think the high auctions for the Boot, the Duck Tray, or the Porcelain Shoe, were game-changers for the entire project. Subsequent results just seem to have too many choppy moments.
I do think it’s probably fair, as Mimi suggests, that some of the very earliest Significant Objects were, in effect, undervalued. I suspect this is partly because of the Duration Factor addressed by Josh, but also because in the early days we not only had a smaller audience and more objects to go around (the first week in particular, we put a whopping 13 items and stories on sale, in an effort to give readers a lot to sink their teeth into right from the start), we were also basically unproven. That first month was in a way one long proof of concept to readers and potential buyers. Who knew if we were really going to pull this crazy idea off, anyway? Who knew if anybody would buy anything? By the time the Metal Boot went on sale, I think we’d answered those questions.
Beyond that, I think these charts leave a lot of open questions, and suggest that maybe weekly averages don’t tell us enough. Stay tuned.
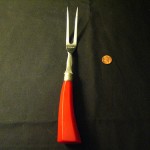


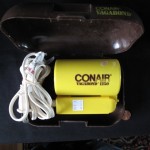
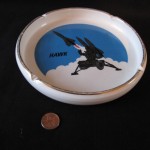
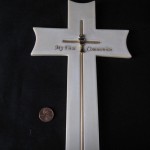
The median prices of the first four weeks never rise above $17.82; and the median prices of the final four weeks never drop below $24.50. So there is likely *some* sort of a Duration Factor at work. I don’t think Mimi’s Metal Boot Peak Effect (or our Barefoot Buyer Syndrome) explains much, though, unless somehow they’re the reason that, except for the Week 7 and Week 10 slumps, after Week 4 the median price never again drops below $20.50. But if the MBPE and BBS don’t account for those slumps, I’m not sure we can place much confidence in them. Also, as the Average v. Weekly High chart shows, we did have some uninhibited bidding before Week 4.
I’d like to present some data showing the project’s modal data, since that will cancel out any distortion we’re getting from a few wildly high sales. But at the same time, I think we ought to move along now to the qualitative part of our analysis. That will be quite tricky (because subjective), but I’m eagerly looking forward to it!